

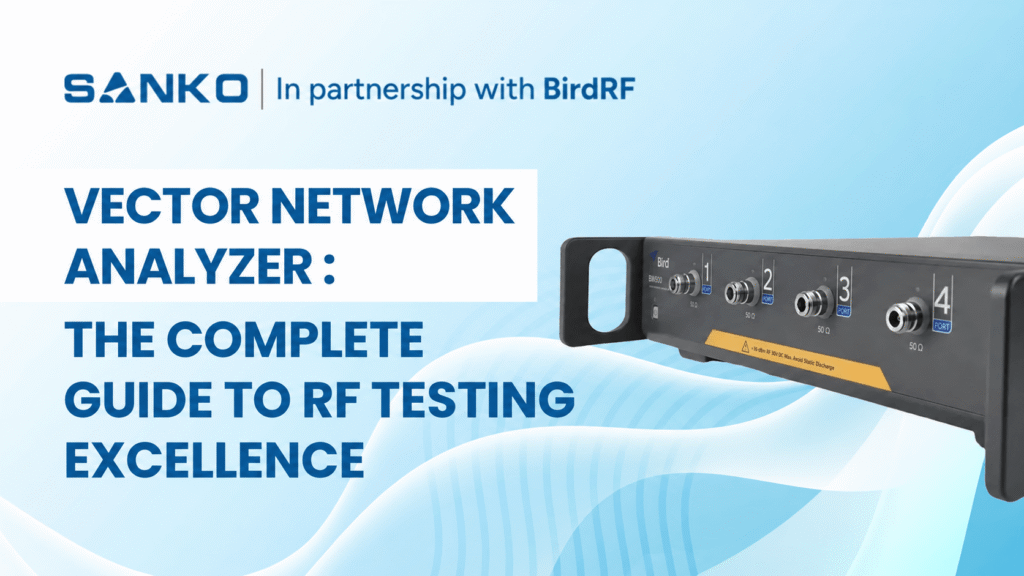
무선 주파수(RF) 기술의 발전은 점점 복잡해지는 통신 시스템에 맞춰 정밀한 측정 장비를 요구합니다. 이러한 기술 발전을 선도하는 것은 벡터 네트워크 분석기로, 최신 RF 엔지니어링 및 테스트 응용 분야에서 널리 사용되는 고성능 기기입니다.
벡터 네트워크 분석기란 무엇입니까?
Vector Network Analyzer (VNA) is a radio frequency (RF) test instrument that measures both the amplitude and phase of high-frequency signals as they reflect from or pass through a device under test (DUT).
It applies a known RF stimulus and measures reflection and transmission as S-parameters, including S11 and S21. Engineers use these results to evaluate antenna matching, filter insertion loss, amplifier gain and cable performance. Accurate measurements require calibration at the DUT connection point.
무선 주파수(RF) 기술의 발전은 점점 복잡해지는 통신 시스템에 맞춰 정밀한 측정 장비를 요구합니다. 이러한 기술 발전을 선도하는 것은 벡터 네트워크 분석기로, 최신 RF 엔지니어링 및 테스트 응용 분야에서 널리 사용되는 고성능 기기입니다.
벡터 네트워크 분석기 이해하기: 기본 RF 측정을 넘어서
A vector network analyzer measures a device’s complex reflection and transmission response across frequency. Unlike a scalar network analyzer, which measures magnitude, a VNA also measures phase. This information helps engineers assess impedance matching, gain, loss and delay in RF components and systems.
In antennas, communications systems and RF circuits, amplitude and phase relationships help explain component performance. Vector measurements support research and development, production testing and suitable field-service applications, depending on the instrument and test setup.
오늘날 네트워크 분석기는 S-파라미터 측정에 적합하며, 이는 전기 네트워크가 다양한 주파수의 신호에 어떻게 반응하는지를 설명합니다. 이 측정은 필터, 커플러, 안테나와 같은 수동 소자는 물론, 증폭기와 믹서 같은 능동 소자의 특성 확인에도 사용됩니다.
How Does a Vector Network Analyzer Work?
The VNA generates a controlled signal and sweeps it across a selected frequency range. Directional couplers separate incident, reflected and transmitted waves. Receivers compare these waves with a reference, and the instrument calculates the DUT’s magnitude and phase response.
The process follows four steps:
- Generate a known RF stimulus.
- Apply the stimulus to the DUT.
- Measure incident, reflected and transmitted signals.
- Calculate and display the response across frequency.
Understanding S11, S21, S12 and S22
S-parameters describe how signals reflect from or travel through a device. For a two-port DUT, four main parameters describe matching and transmission in both directions.
| 매개변수 | Measurement | Typical use |
| S11 | Input reflection | Antenna matching and input return loss |
| S21 | Forward transmission | Filter loss, cable loss and amplifier gain |
| S12 | 역전송 | Reverse isolation or transmission |
| S22 | Output reflection | Output matching and return loss |
For a passive filter, S21 shows the transmitted signal across the passband and stopband. S11 shows input reflection. Reviewing both helps distinguish poor matching from other causes of transmission loss.
RF 벡터 네트워크 분석기의 산업별 응용
RF 벡터 네트워크 분석기는 여러 산업 분야에서 광범위하게 채택되어 각기 고유한 기능을 특정 응용 분야에 활용하고 있습니다. 통신 분야에서는 이 장비들이 기지국 장비의 설계 및 테스트에 필수적이며, 최적의 신호 전송 및 수신 특성을 보장합니다. 5G 및 신흥 6G 기술의 복잡성이 증가함에 따라 고성능 RF 측정 솔루션에 대한 수요도 더욱 커지고 있습니다
항공우주 및 방위 산업 응용 분야는 레이더 시스템 개발, 위성 통신 장비 테스트 및 전자전 시스템 특성 분석을 위해 RF 벡터 네트워크 분석기에 크게 의존합니다. 이 장비들은 필터, 안테나, 파워 증폭기 등 다양한 수동 및 능동 장치의 무선 주파수(RF) 및 마이크로파 부품 분석에 필수적입니다.
The automotive industry has become another significant user of RF vector network analyzers, particularly with the advancement of connected vehicle technologies, automotive radar systems, and vehicle-to-everything (V2X) communication protocols. These applications require precise RF component characterisation to ensure reliable performance in challenging automotive environments.
USB 벡터 네트워크 분석기의 부상: 휴대용 정밀도
A USB vector network analyzer uses a connected computer for its interface and measurement control. Professional PC-controlled models can support demanding RF measurements while reducing the space occupied by dedicated instrument displays and controls.
USB connectivity does not determine accuracy, frequency range or suitability. Professional laboratory instruments and hobbyist VNAs can differ considerably. Compare the specifications, calibration capabilities and supported measurements of the particular model.
USB 벡터 네트워크 분석기는 일반적으로 USB 인터페이스를 통해 표준 개인용 컴퓨터에 연결되며, 최신 PC의 처리 능력과 디스플레이 기능을 활용합니다. 이러한 접근법은 기기 비용을 절감하는 동시에 사용자가 익숙한 인터페이스와 전문 소프트웨어 응용 프로그램을 통한 광범위한 데이터 처리 기능을 제공합니다.
Portability depends on the complete setup, including the computer, power supply, cables and calibration accessories. For outdoor work, check battery operation, environmental limits and ruggedness rather than assuming every USB VNA is field-ready.
USB 벡터 네트워크 분석기의 주요 장점
- Compact size – Saves bench space.
- PC integration – Simplifies viewing and saving results.
- Programmable control – Supports repeated test sequences
- Portable arrangement – Can move between workstations
- Software options – Can enable supported analysis functions
Technical Specifications and Performance Metrics
VNA specifications should be compared under conditions that reflect your application. Dynamic range, trace noise and speed depend on frequency, configuration and measurement settings. A headline figure does not describe performance in every operating condition.
| 사양 | Why it matters | What to confirm |
| 주파수 범위 | Defines the bands you can measure | Required start and stop frequencies |
| Port count | Defines available measurement paths | Reflection, transmission or multiport needs |
| 다이내믹 레인지 | Supports measurement of weak transmission | Performance at the required frequencies and settings |
| Trace noise | Affects small response changes | Specified IF bandwidth and averaging |
| Source power | Sets the stimulus applied to the DUT | Suitable range and adjustment capability |
| 측정 속도 | Affects test throughput | Sweep time at the required accuracy |
| Calibration support | Establishes the reference plane | Suitable standards and methods |
IF bandwidth controls part of the receiver’s noise-versus-speed trade-off. A narrower setting can reduce noise but usually increases measurement time. Choose settings based on whether you need fast production screening or detailed component characterisation.
Frequency coverage varies widely among USB and benchtop VNAs. Some professional PC-controlled models reach microwave bands, while others serve lower-frequency applications. Check the datasheet and required options rather than choosing by instrument format alone.
교정 및 측정 정확도
정확한 측정을 위해서는 벡터 네트워크 분석기의 체계적인 오차를 고려한 적절한 교정 절차가 필요합니다. 벡터 네트워크 분석기는 기기, 케이블, 어댑터 및 테스트 픽스처의 체계적 오차를 보정함으로써 매우 정확한 측정을 달성합니다
표준 교정 절차에는 동축 측정을 위한 단락-개방-부하-통과(SOLT) 교정과 특수 응용을 위한 통과-반사-선(TRL) 교정이 포함됩니다. 최신 기기들은 이 중요한 과정을 간소화하면서도 측정의 반복성과 정확성을 보장하는 자동 교정 루틴을 자주 포함하고 있습니다
Calibration establishes a measurement reference plane. When a cable connects the VNA to the DUT, calibrating at the cable’s end helps account for its effects. Anything added beyond that reference plane can still influence the measured result.
| Calibration approach | Typical application |
| One-port open, short and load | Antenna reflection and input matching |
| Full two-port SOLT | Coaxial reflection and transmission measurements |
| TRL | Suitable fixture, transmission-line or on-wafer testing |
| Electronic calibration | Simplifying calibration with a compatible module |
Calibration reduces systematic errors but cannot eliminate every source of uncertainty. Noise, connector repeatability and changes after calibration can remain. Keep cables stable and use a suitable verification device to check that the setup behaves as expected.
Reassess calibration after changing cables, adapters or the test arrangement. Confirm that calibration standards match the connector type and frequency range. Calibration kits and electronic modules may be separate purchases.
For a deeper explanation, read our guide to practical VNA calibration and measurement techniques.
Vector Network Analyzer Tutorial: Your First Measurement
Begin with a simple task, such as antenna reflection or transmission through a cable. Define the operating band and the result you need before choosing the settings.
- Prepare the setup. Inspect connectors, select suitable cables and follow the manufacturer’s stabilisation guidance.
- Set the sweep. Choose start and stop frequencies covering the DUT’s operating band.
- Select the measurement. Use S11 for input reflection or S21 for forward transmission.
- Set test conditions. Choose appropriate source power, measurement points and IF bandwidth.
- Calibrate. Establish the reference plane at the intended DUT connection point.
- Connect and measure. Keep the calibrated arrangement stable.
- Review and save. Use markers to examine key frequencies and record settings with the results.
For transmission testing, connect the DUT between two test ports. For a simple antenna reflection measurement, connect the antenna at the calibrated port or cable end. Follow instrument and DUT limits, especially when testing active components.
Vector Network Analyzer Antenna Measurement
A VNA measures an antenna’s input reflection to evaluate impedance matching across frequency. Common displays include S11, return loss, VSWR and the Smith chart. Calibrate at the antenna connection point and measure across the intended operating band.
| Measurement | What it tells you |
| S11 | Reflection from the antenna input |
| Return loss | Reflected signal level relative to the incident signal |
| VSWR | Degree of impedance mismatch |
| Smith chart | Resistance and reactance across frequency |
| Impedance bandwidth | Frequency range meeting a defined matching limit |
For a passive antenna, a more negative S11 magnitude in dB means less reflection. Return loss expresses this relationship as a positive value. For example, S11 of −20 dB corresponds to 20 dB return loss.
| S11 magnitude | Return loss | Reflected power | Approximate VSWR |
| −10 dB | 10 dB | 10% | 1.92:1 |
| −15 dB | 15 dB | 3.20% | 1.43:1 |
| −20 dB | 20 dB | 1% | 1.22:1 |
These relationships follow the standard return-loss and VSWR calculations.
Use the antenna or system specification to decide whether a result is acceptable. These values describe matching, not a universal pass/fail threshold.
Good matching alone does not establish antenna gain, radiation pattern or efficiency. An antenna can accept power while losing some of it rather than radiating effectively. Those characteristics require additional measurements and a suitable antenna test arrangement.
The enclosure, mounting position and nearby objects can change antenna impedance. Test under conditions that represent the intended installation and keep the arrangement consistent when comparing results.
최신 테스트 시스템과의 통합
현대 RF 테스트 환경은 자동 테스트 장비(ATE) 및 생산 라인 시스템과 원활하게 통합될 수 있는 기기를 점점 더 요구하고 있습니다. USB 벡터 네트워크 분석기는 표준 컴퓨터 인터페이스와 소프트웨어 기반 제어 시스템 덕분에 이러한 응용 분야에서 뛰어난 성능을 발휘합니다.
Both benchtop and PC-controlled VNAs may support automation. Check the model’s control interface, commands, drivers and software licences. Manufacturing plug-ins and advanced test functions are model-specific rather than standard features of every VNA.
프로그래밍 인터페이스, SCPI(프로그래머블 기기용 표준 명령) 호환성을 포함하여, 엔지니어들이 맞춤형 테스트 시퀀스를 개발하고 벡터 네트워크 분석기 측정을 더 광범위한 시스템 검증 절차에 통합할 수 있도록 합니다. 이러한 프로그래밍 가능성은 기본 측정을 넘어 보다 포괄적인 시스템 특성화까지 기기의 활용도를 확장합니다.
Before automating, establish a repeatable manual measurement and define:
- Calibration and verification procedures.
- Sweep settings, source power and test limits.
- DUT identification and result storage.
- Actions for failed measurements or lost connections.
전통적인 벤치탑 분석기와의 비교
Choose the instrument format around the working environment and required measurements. Benchtop, USB and handheld VNAs can serve professional applications, but their capabilities vary by model.
| 매개변수 | Benchtop VNA | USB or PC-controlled VNA |
| 인터페이스 | Usually integrated display and controls | Host computer and software |
| Bench space | Dedicated instrument footprint | Compact hardware plus computer |
| 성능 | Depends on the model and options | Depends on the model and options |
| 휴대성 | Depends on size and power needs | Depends on the complete setup |
| Automation | Available on supported models | Available on supported models |
| Upgrades | Hardware and software options vary | Hardware and software options vary |
Compare total setup cost, supported measurements and specified accuracy. Neither lower cost nor equivalent performance follows automatically from USB connectivity. Software upgrades can enable supported functions but cannot remove fundamental hardware limits.
VNA vs Spectrum Analyzer vs Antenna Analyzer
| Instrument | Main purpose | Example task |
| Vector network analyzer | Measures a DUT’s response to a known stimulus | Filter loss and antenna matching |
| Spectrum analyzer | Examines signal power across frequency | Interference and unwanted emissions |
| Cable and antenna analyzer | Supports installation and maintenance measurements | Feedline matching and fault location |
Some instruments combine these functions. Spectrum analyzers with tracking generators can perform certain response measurements, but phase measurement and calibration capabilities differ. Confirm which functions the instrument supports.
For field-testing considerations, see our guide to handheld spectrum and cable analyzers.
미래 동향 및 기술 발전
벡터 네트워크 분석기 시장은 기술 요구 사항의 발전과 새로운 응용 분야의 등장으로 계속 진화하고 있습니다. 증가된 주파수 커버리지, 향상된 동적 범위, 그리고 개선된 측정 속도는 업계 전반에 걸쳐 지속적인 개발 우선 순위입니다.
For buyers, practical developments include wider frequency coverage, multiport testing and stronger software integration. Assess each capability against your project rather than relying on broad claims about future technologies.
Software can expand supported analysis and automation functions. However, frequency coverage, receiver performance and other hardware characteristics still define the instrument’s measurement limits.
How to Choose a High-Frequency Network Analyzer for 6G R&D
Begin with the research band, DUT and required measurement. Different 6G research projects need different systems. A “6G-ready” description alone does not establish suitability.
- Frequency coverage: Confirm calibrated operation across the research band.
- Extension capability: Check whether compatible frequency extenders are required.
- Connections: Assess suitable connectors, waveguides or probes.
- Calibration: Establish the reference plane at the DUT.
- Performance: Check dynamic range and uncertainty at the intended frequencies.
- Measurement scope: Decide whether S-parameters are sufficient or additional instruments are needed.
Advanced component testing may involve a VNA, frequency extenders, controllers and signal-generation hardware. Evaluate the complete measurement system, including calibration and accessories, rather than the analyzer’s maximum frequency alone.
귀하의 용도에 맞는 벡터 네트워크 분석기 선택하기
적절한 벡터 네트워크 분석기를 선택하려면 주파수 범위 요구 사항, 동적 범위 사양, 포트 구성 및 예산 제약 등 여러 주요 요소를 신중하게 고려해야 합니다. 전통적인 벤치탑 방식과 USB 기반 솔루션 중 선택은 주로 특정 응용 요구사항과 운용 제한에 따라 달라집니다.
For field testing, assess battery operation, ruggedness and the full setup’s portability. For laboratory and production work, prioritise measurement performance, repeatability and automation. A USB VNA can be suitable when its specifications and working arrangement match these requirements.
교육 기관들은 점점 더 USB 벡터 네트워크 분석기를 선호하고 있습니다. 이 기기들은 전문적인 성능과 합리적인 가격을 동시에 제공하기 때문입니다. 이러한 장비는 학생들이 전문 RF 공학에서 사용하는 동일한 측정 원리를 직접 체험할 수 있게 해주면서도 일반적인 교육 예산에 맞춥니다.
| 애플리케이션 | Requirements to assess |
| Antenna matching | Operating band, reflection accuracy and one-port calibration |
| Cable and filter testing | Two-port capability, transmission accuracy and dynamic range |
| Amplifier testing | Source power, receiver limits and supported active-device functions |
| PCB components | Fixtures, calibration access and de-embedding |
| Multiport devices | Port count, switching arrangement and calibration workflow |
| Production testing | Speed, repeatability and programmable control |
Include calibration standards, suitable cables, adapters, software and any host computer in the quotation. Confirm which functions are included and which require additional licences or hardware.
For devices with several signal paths, explore multi-port and multi-band VNA measurements. For fixture-connected DUTs, read about VNA fixture simulation and de-embedding.
Common VNA Measurement Problems
Unexpected results can come from the DUT, test arrangement or settings. Check the setup before deciding that a component has failed.
- Trace changes when a cable moves – Cable stability, connector condition and calibration validity
- Results differ after reconnection – Connection repeatability and connector handling
- PCB component shows unexpected loss Fixture effects and reference-plane placement
- Noisy measurement trace IF bandwidth, averaging and received signal level
- Good antenna matching but poor range Feedline loss, radiation performance and interference
- Deep filter rejection reaches a flat floor Noise floor, leakage and available dynamic range
Where supported, time-domain analysis can help locate cable discontinuities. Distance-to-fault results also depend on settings such as cable velocity factor. Read our guide to distance-to-fault testing with a VNA.
Sanko: RF 테스트 솔루션에서 신뢰할 수 있는 파트너
When it comes to sourcing high-quality vector network analyzers and RF testing equipment, we are a reliable partner for engineers and organisations worldwide. Our comprehensive product portfolio includes both traditional benchtop and cutting-edge USB vector network analyzers from leading manufacturers, ensuring that our customers have access to the most advanced measurement technologies available.
저희는 성공적인 RF 프로젝트가 정확한 측정과 신뢰할 수 있는 계측기에 달려 있음을 이해하고 있습니다. 저희 기술 전문가들은 연구실, 생산 시설, 현장 테스트 환경 등 고객의 특정 응용 분야에 최적의 벡터 네트워크 분석기 솔루션을 찾기 위해 고객과 긴밀히 협력합니다.
저희의 약속은 단순한 제품 판매를 넘어, 포괄적인 기술 지원, 교정 서비스, 그리고 고객이 RF 테스트 장비에 대한 투자를 최대한 활용할 수 있도록 돕는 교육 프로그램을 포함합니다. 이러한 총체적 접근 방식은 고객이 효율적이고 정확하게 측정 목표를 달성할 수 있도록 보장합니다
자주 묻는 질문
Is an RF Network Analyzer the Same as a VNA?
An RF network analyzer is a broader description. A vector network analyzer measures magnitude and phase, while a scalar network analyzer measures magnitude. Check the supported measurements when comparing equipment.
Can a USB Vector Network Analyzer Replace a Benchtop VNA?
It can when its frequency coverage, accuracy, ports and measurement functions meet the application. USB describes the connection and working arrangement. Compare specific models and complete setups before choosing.
Can a VNA Locate a Fault in a Cable?
Some VNAs support time-domain or distance-to-fault measurements. These functions use reflection data to help locate discontinuities. Availability and setup requirements depend on the instrument and installed options.
Does Good Antenna Matching Guarantee Good Performance?
No. Return loss and VSWR describe matching, but do not establish gain, radiation efficiency or coverage. Additional testing may be necessary to assess the antenna’s overall performance.
What Information Should I Provide When Requesting a VNA Quotation?
Provide the DUT type, operating frequencies, required ports, measurements, accuracy needs and expected test volume. Include the working environment and existing accessories. This helps identify suitable vector network analyzer solutions and equipment for a complete setup.
지금 Sanko의 RF 테스트 역량을 향상시키세요
무선 주파수(RF) 엔지니어링 분야는 무선 기술의 진보, 증가하는 주파수 요구, 그리고 성능 향상에 대한 요구가 맞물리면서 전례 없는 속도로 발전하고 있습니다. 차세대 통신 시스템을 개발하든, 정밀 RF 부품을 설계하든, 중요한 무선 인프라를 유지보수하든, 적절한 벡터 네트워크 분석기는 프로젝트의 성공과 어려움 사이를 가르는 중요한 요소가 될 수 있습니다
구식 측정 장비가 귀하의 혁신 잠재력을 제한하지 않도록 하십시오. 현장 테스트에 적합한 소형 USB 솔루션부터 가장 까다로운 응용 분야를 위해 설계된 고성능 시스템에 이르기까지 다양한 벡터 네트워크 분석기를 살펴보십시오. 당사의 전문가 팀이 귀하의 기술 요구 사항, 예산 제약 및 성능 목표에 맞는 이상적인 측정 솔루션을 찾는 데 도움을 드릴 준비가 되어 있습니다.
RF 테스트 역량을 혁신할 준비가 되셨나요? 문의하기 하셔서 첨단 vector network analyzer 솔루션이 귀하의 프로젝트를 가속화하고 측정 품질을 향상시키며, 오늘날의 빠르게 변화하는 RF 시장에서 경쟁 우위를 제공하는 방법을 확인해 보세요. 여러분의 다음 혁신은 단 한 번의 측정에서 시작됩니다.
 Korean
 English
 Chinese
 Japanese
 Spanish